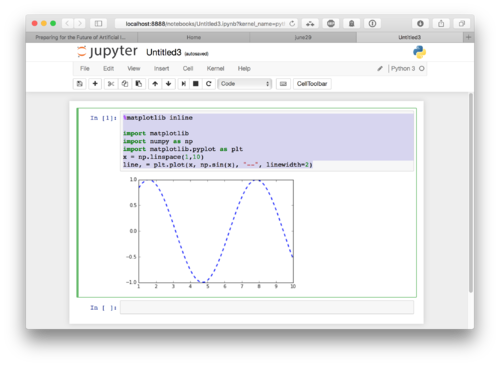
Short example of using matplotlib within jupyter
From Simson Garfinkel
Jump to navigationJump to search
The printable version is no longer supported and may have rendering errors. Please update your browser bookmarks and please use the default browser print function instead.
Enter this:
   %matplotlib inline
   import matplotlib
   import numpy as np
   import matplotlib.pyplot as plt
   x = np.linspace(1,10)
   line, = plt.plot(x, np.sin(x), "--", linewidth=2)
And here is what it looks like:
