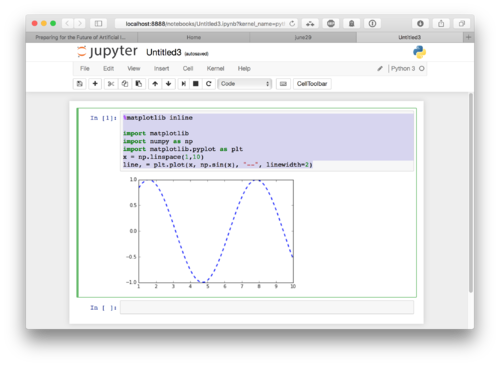
Short example of using matplotlib within jupyter
From Simson Garfinkel
Jump to navigationJump to search
Enter this:
   %matplotlib inline
   import matplotlib
   import numpy as np
   import matplotlib.pyplot as plt
   x = np.linspace(1,10)
   line, = plt.plot(x, np.sin(x), "--", linewidth=2)
And here is what it looks like:
